Making More of Your Data: From Storytelling to Future-Prepping
By Wendy Collins, Founder & Principal
of The Catalyst Partners

Every company has core services and offerings that are just a bit outside of their wheelhouse. Smart companies have a strong network of experts that they can bring in when the need demands it. The Catalyst Partners, with whom we work on larger-scale data projects, is one of these exceptional partners. In this piece, Catalyst’s founder, Wendy Collins, explains the four phases of data monetization.
What are the phases of data monetization?
The best data visualizations tell a story. Usually, that story is about what’s already happened. Or maybe, one-step better, about what is happening. And, certainly, that is better than telling no story at all. But what if your data could tell you not just what already happened, but what is likely to happen next – and then tell you what you should do about it?
Even for the data-nascent, that’s well within the realm of the possible! Not only is it possible, it can be highly beneficial to your bottom line.
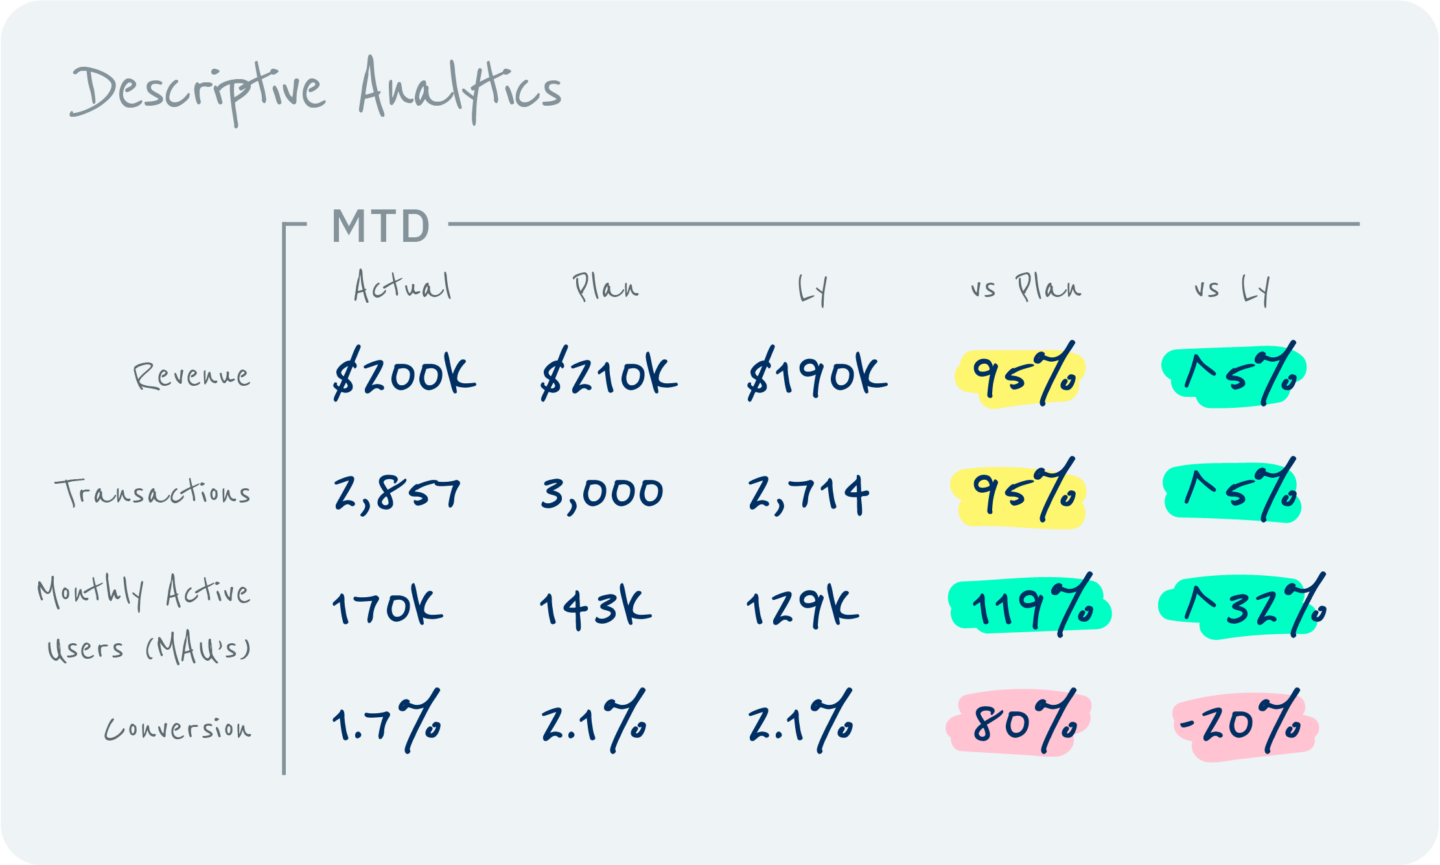
You see, while stories of the past are important to help us understand the world around us, they are only the first step in the data monetization journey. The story of “what happened” (i.e., “descriptive” analytics) is important because without that information, planning the future can be very difficult.
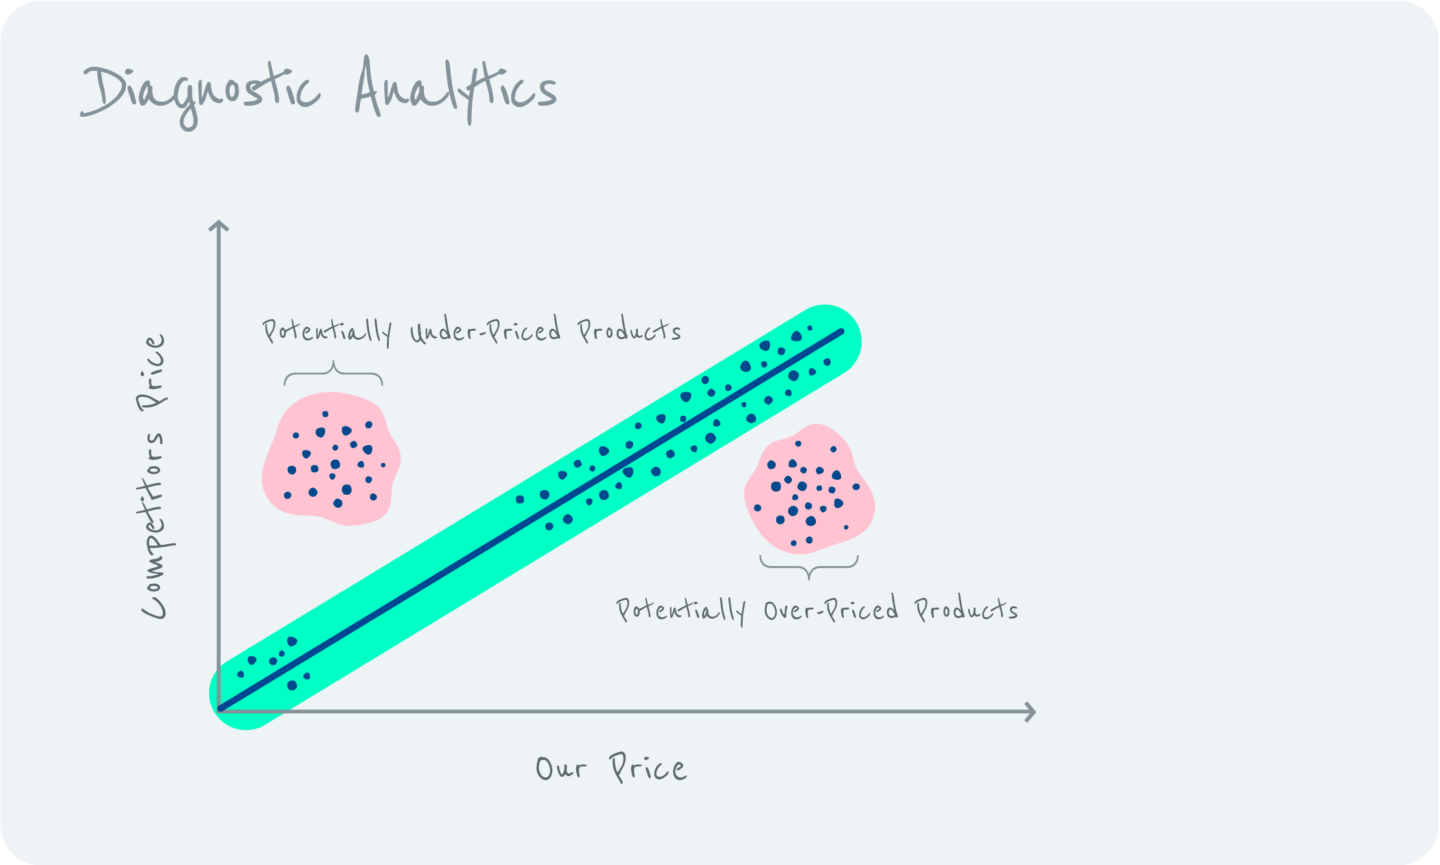
The good news is that your data likely offers signals that help us understand not just what happened, but why it happened (i.e., “diagnostic” analytics) and what is likely to happen (i.e., “predictive” analytics) that then allows you to identify the best next action (i.e., “prescriptive” analytics) to generate more revenue, acquire more customers, deepen connections to your brand, grow margins, or whatever your business objective may be. (In other words, this monetization from your data can be very direct, as in cases where we are aiming to optimize sales conversion directly. But the four phases of data can also be used to optimize other parts of the marketing funnel for different objectives.)
Each one of the four phases of data monetization – Descriptive Analytics, Diagnostic Analytics, Predictive Analytics, and Prescriptive Analytics – allows you to potentially unlock additional insights regarding where your business is headed and how you can influence that trajectory.
This simple scenario explains the differences
Take, for example, the movie theater operator who is sitting on a data warehouse full of historical box office data and has built beautiful dashboards to show how their prices have fluctuated over time (descriptive analytics). While they may know how many tickets they sold at what price when, by not augmenting that data with film title, weather, and theater-specific information, they may not be able to fully diagnose why some of their theaters consistently have empty seats (a.k.a. spoilage or expired-inventory). And, without a demand forecasting tool (predictive analytics) they may understaff theater operations during high-attendance situations resulting in long concessions lines and less-than-tidy auditoriums or experience costly overstaffing and underutilization during low-attendance periods. If they could predict attendance, not only might it result in a better customer experience and lower operating expenses, they could also identify theaters in which the upcoming slate of films might not match local interests far enough in advance so the general manager has time to plan other programming and/or promotions to drive attendance (prescriptive analytics).
To get started, you can ask yourself these questions
What if, you may be asking, my business is not as straightforward as the movie theater operations example above? Below are some common data monetization questions, some of which may already be on your mind.
Question 1: I don’t have a data repository that’s ready to be analyzed. How do I monetize what I have?
Answer 1: Well, the first order of priorities is to determine what data you have and where it sits. Even if it’s all in spreadsheets, with a small investment of time to organize and do some light “cleansing” there may be opportunities to use it for analyzing your business.
Question 2: I am the “first and only” in my category. What data do I use?
Answer 2: For you, monetization may be less about using data for upfront decisioning and more about ensuring you’re building your business with the ability to collect data from the start. It’s very easy given everything that needs to be done for a new product or service launch to push data instrumentation/collection activities to a future release, but you do a disservice to your future self (and your P&L) every day you delay collecting data.
Question 3: This all makes sense, but where do I begin?
Answer 3: The answer depends on (1) your business needs and (2) the volume and quality of the data you already have. Here are a few common scenarios:
(a) I need to reduce customer churn. If you aren’t already collecting data on why your customers churn, that’s the place to start. If, however, you have a data set, even if it’s from just a sample of customers, there is plenty of information you can tease out of it by conducting descriptive and diagnostic analytics activities on it.
(b) I need to grow top-line revenue. The answer here depends again on the data you have available. If you have several years of data and already have done some descriptive analysis to determine what product lines have the most potential, then you may be able to jump directly into predictive analytics to determine differences in customer willingness-to-pay and identify promotional opportunities or customer cohorts to target.
(c) I need to acquire new customers. If you don’t already have a CRM tool so you can understand your current customer make-up, then descriptive analytics on your current customer base is the best starting point. If you already know the profile of your core customer, then a reasonable next step may be to leverage predictive analytics to do lookalike modeling against a prospect database.
(d) I want to improve margins. The answer here depends a lot on your financial data. Many companies use average margin calculations rather than exact margin by product or sku. If this is the case, consider diagnostic analytics as your starting point since you’ll first need to spend time decomposing the elements that go into your margin calculation. If you are fortunate enough to have precise margin definitions at your disposal, then you are potentially a good candidate to engage in prescriptive analytics to refine the resources you allocate by product to maximize your overall margin. Or, alternatively, you may want to focus on a handful of products that are underperforming on margin with diagnostic analytics to uncover commonalities and root causes.
There is no one right way to monetize your data, but that’s actually a good thing because it means that no matter where you are in your data journey, there are opportunities to gain insights that lead to the kind of growth your business needs.
In summary, the four phases of data monetization are as follows:
Descriptive Analytics:

- Answers the question “What happened?”
- It is the first step in a mature data monetization process and can often be the hardest in an organization that is just learning to be data-oriented.
- The tools most often used for descriptive analytics include standard reporting, visualization tools like Tableau or Power BI, and custom dashboards.
Diagnostic Analytics:

- Answers the question “Why did it happen?”
- Often requires combining internal data with external data and initially may be an ad hoc activity lead by an analytics or data-science team member
- The tools most often used for diagnostics include analysis software such as Alteryx, Matlab, and SAS
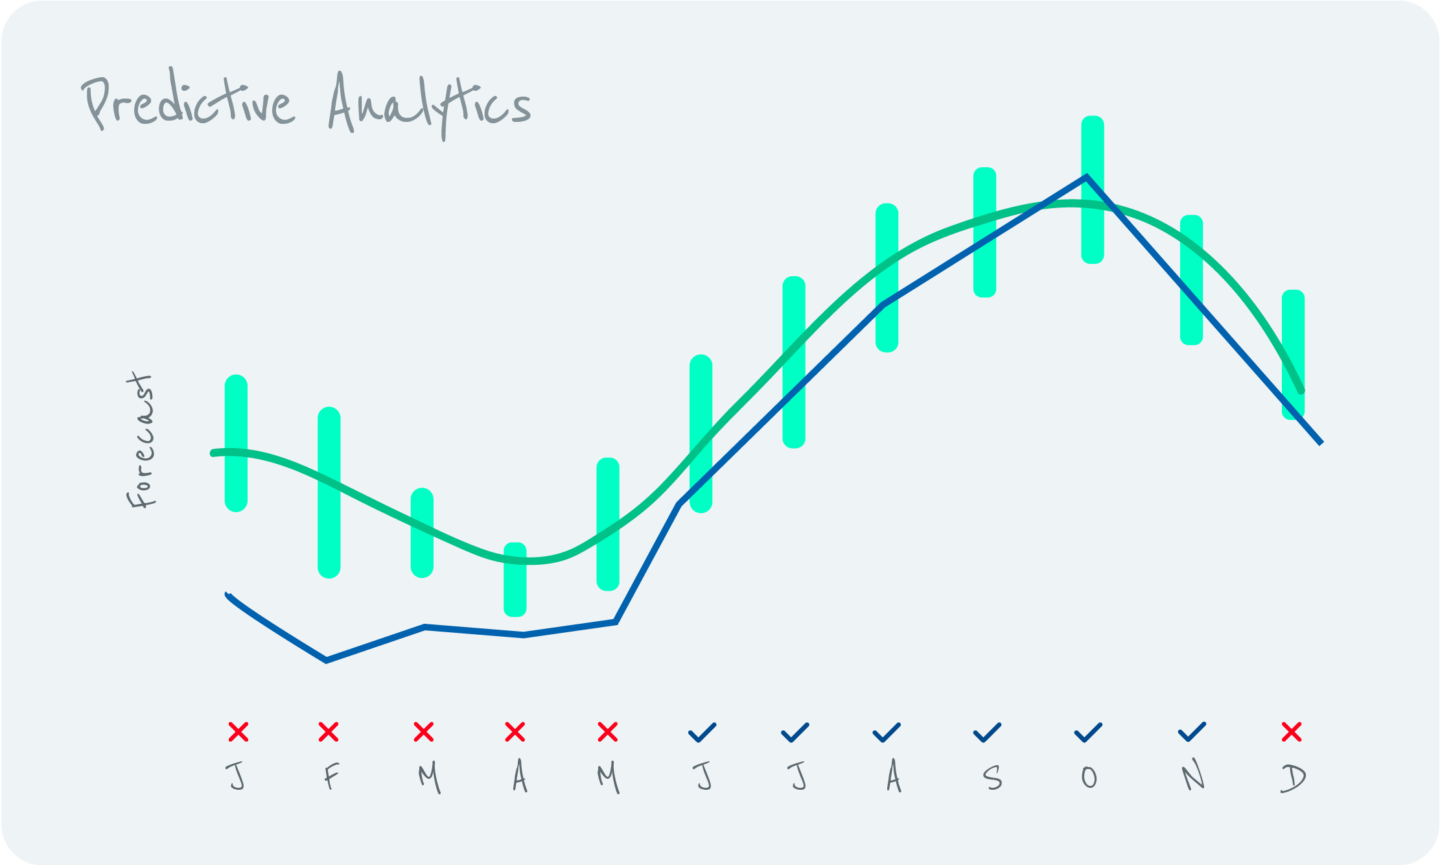
Predictive Analytics:

- Answers the question “What is likely to happen next?”
- Best done in two steps: (1) build and train your forecasting model ensuring you account for correlation and causation then (2) deploy your model to run regularly on updated data.
- The tools most often used for building forecasting models include analysis software such as Alteryx, Matlab and SAS or custom-coded models in Python or other modeling language.
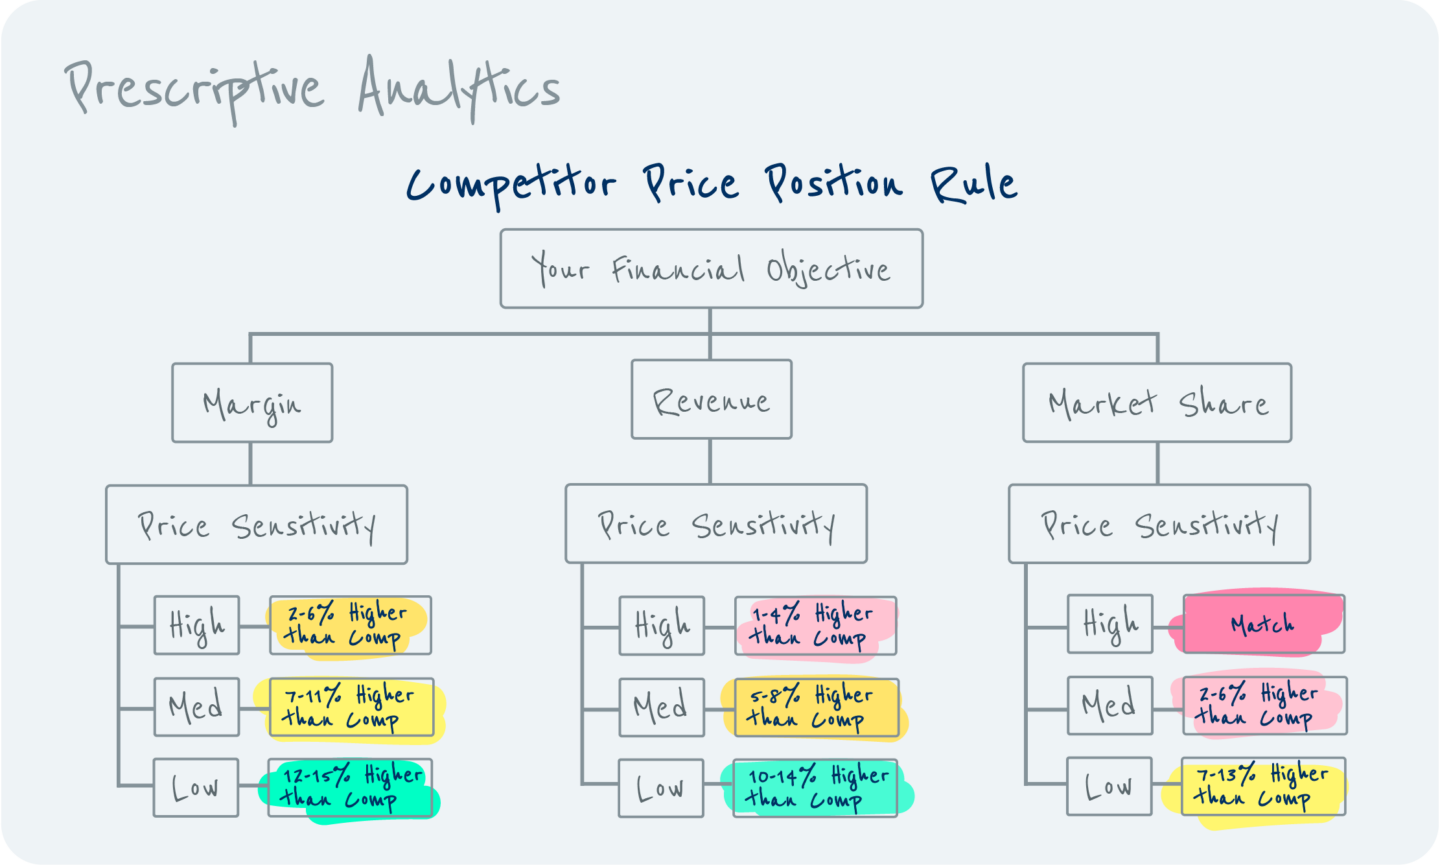
Prescriptive Analytics:

- Answers the question “What should I do next?”
- Recommendation or decision engines are usually based on one or more optimization models or data-driven algorithms that take both forecast model results and desired business objective as inputs to generate recommended actions.
- For simple, rule-based decision engines, sometimes Excel is all you need to provide meaningful direction. However, for more complex recommendation engines, custom-coded models in Python or even large-scale optimization solvers like Gurobi or CPLEX are required to get a quality solution.
What’s interesting about the data monetization journey is that not only does it not have to be taken linearly, but you may find you’re further along in some areas of your business than others. It may be easier, for example, to start with descriptive analytics for one set of products or services and jump straight into predictive analytics for another.
Just like any other journey in life, the key is having the right guide to get you where you want to go. ExpandTheRoom and The Catalyst Partners team up to help our clients make the most of their data monetization journeys, whether they are just embarking on the road or tackling their latest challenge en route to greater success.